chair | 3d animation
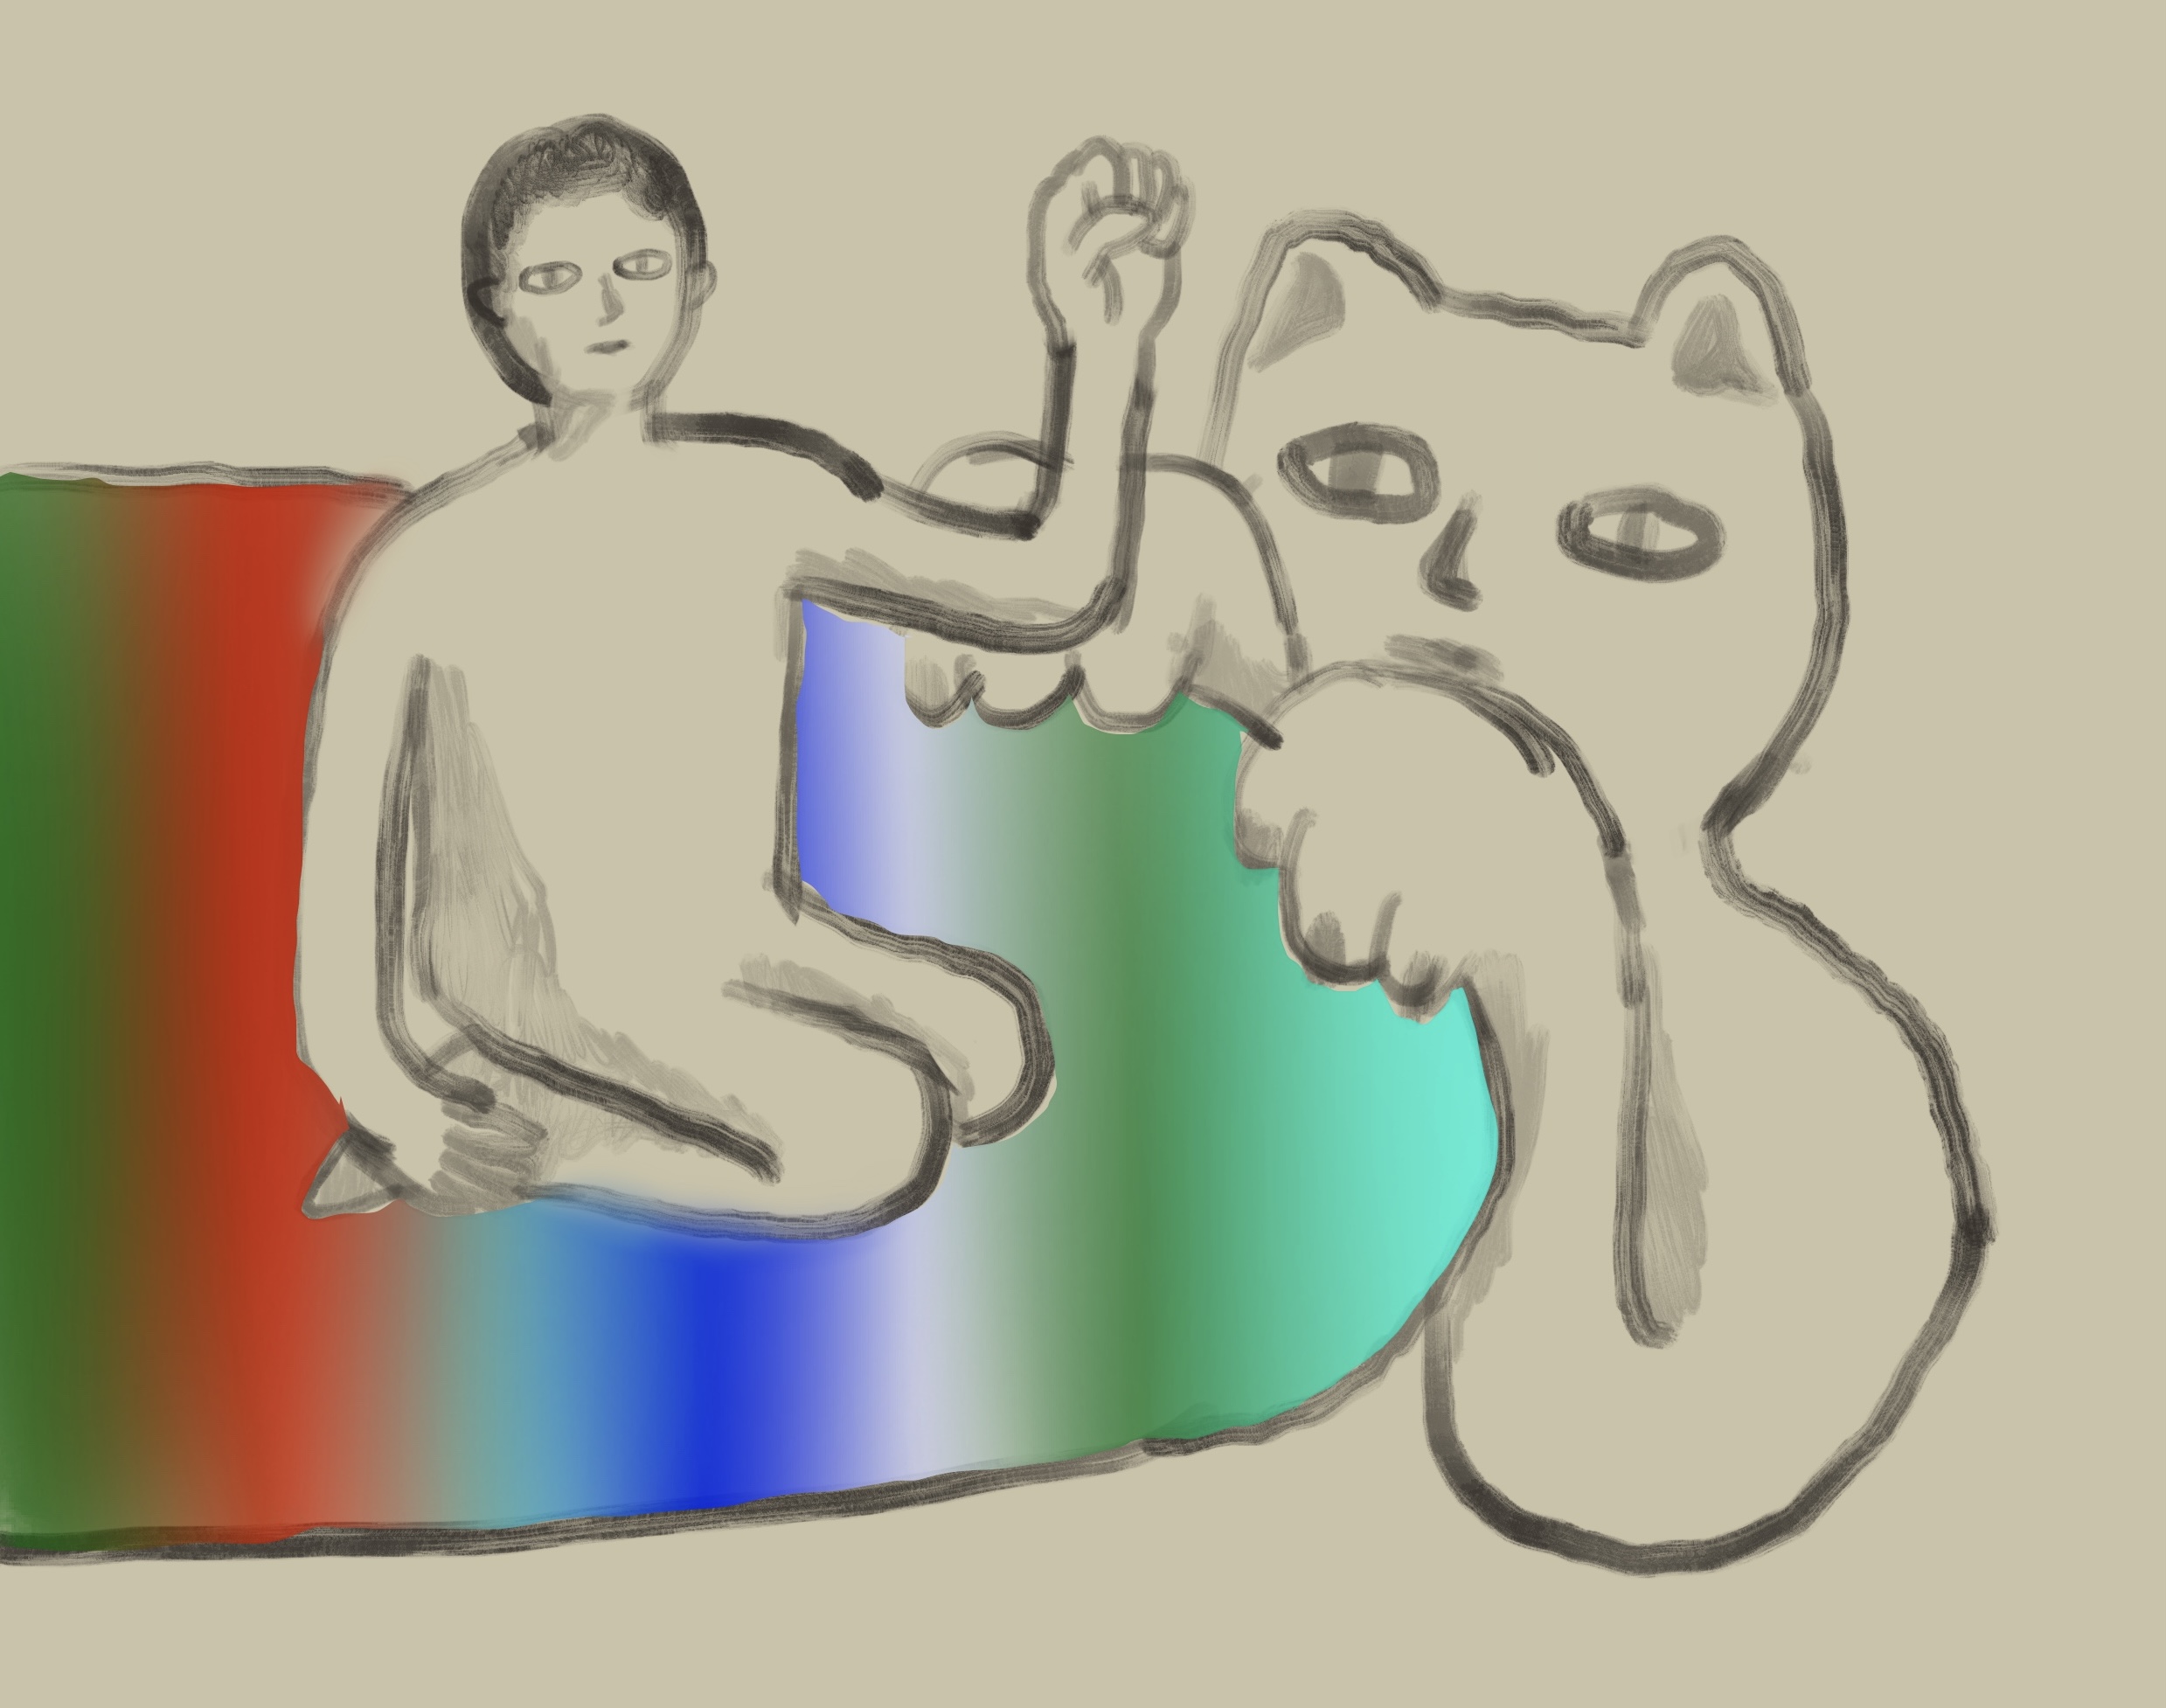
no title | illustration for ArtHaus fair
 ...
...
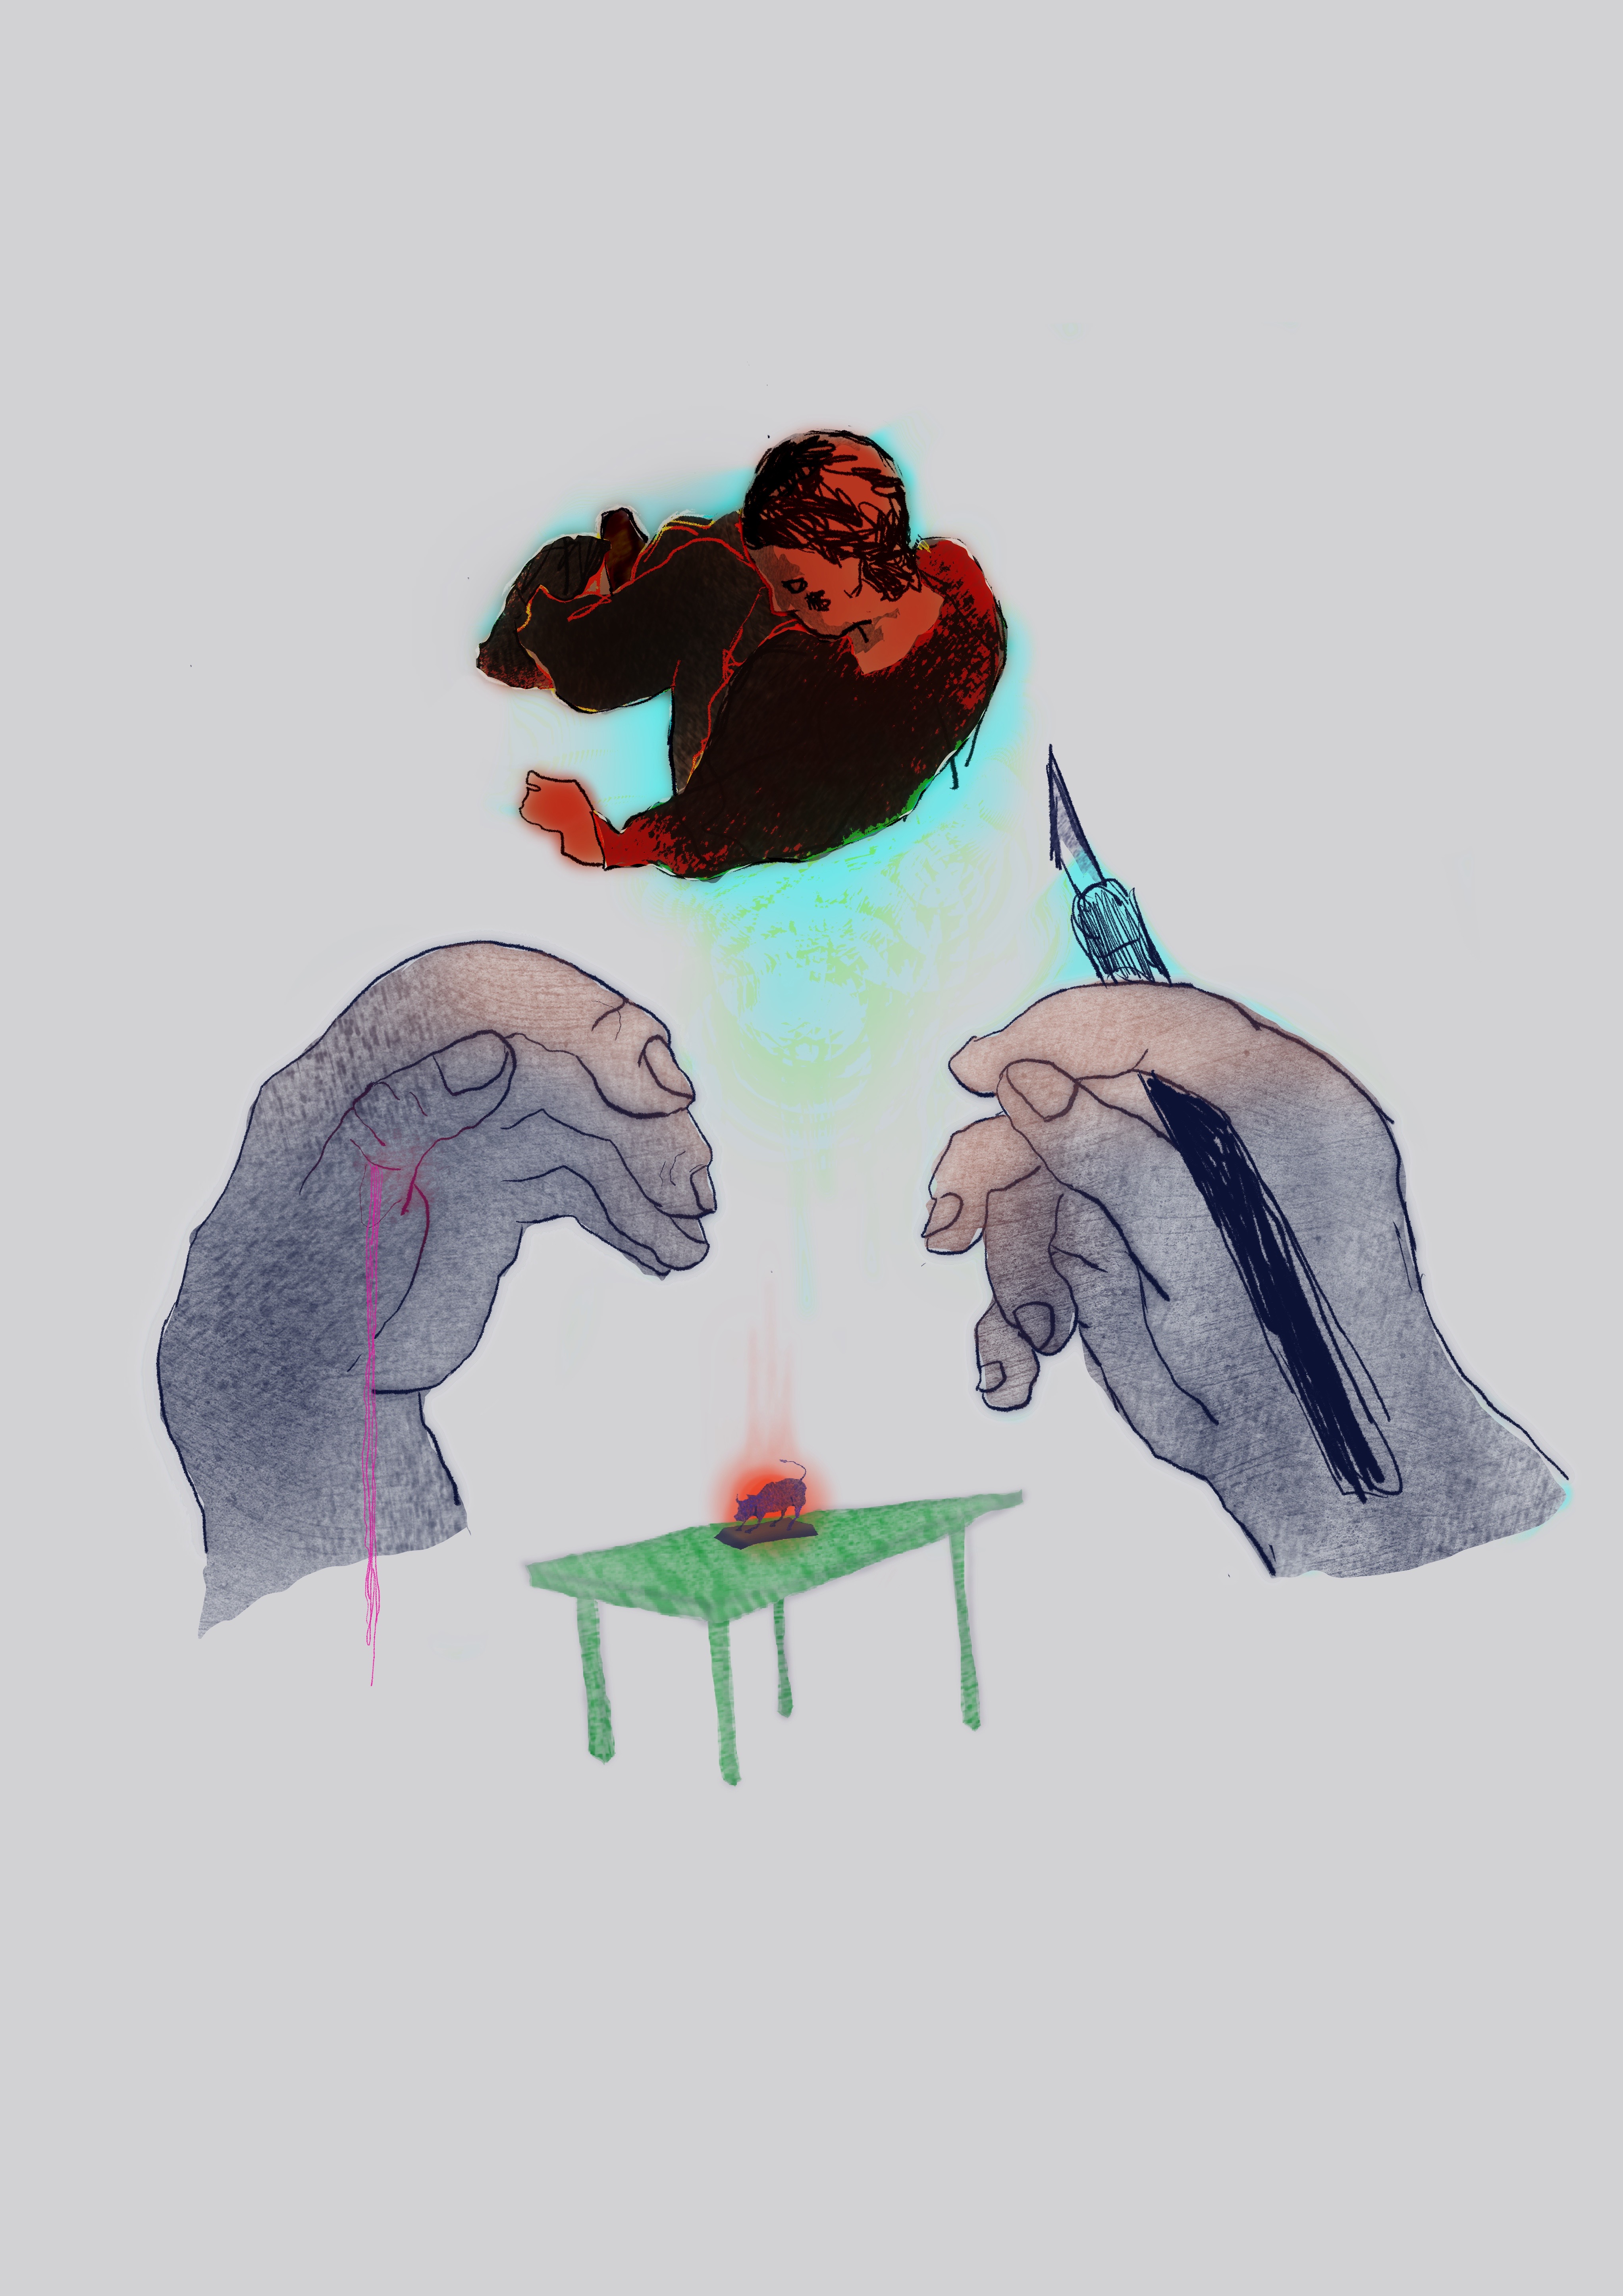
article cover art | On Century Avenue
Simple cover art commision for OCA, the NYUshanghai official student publication.
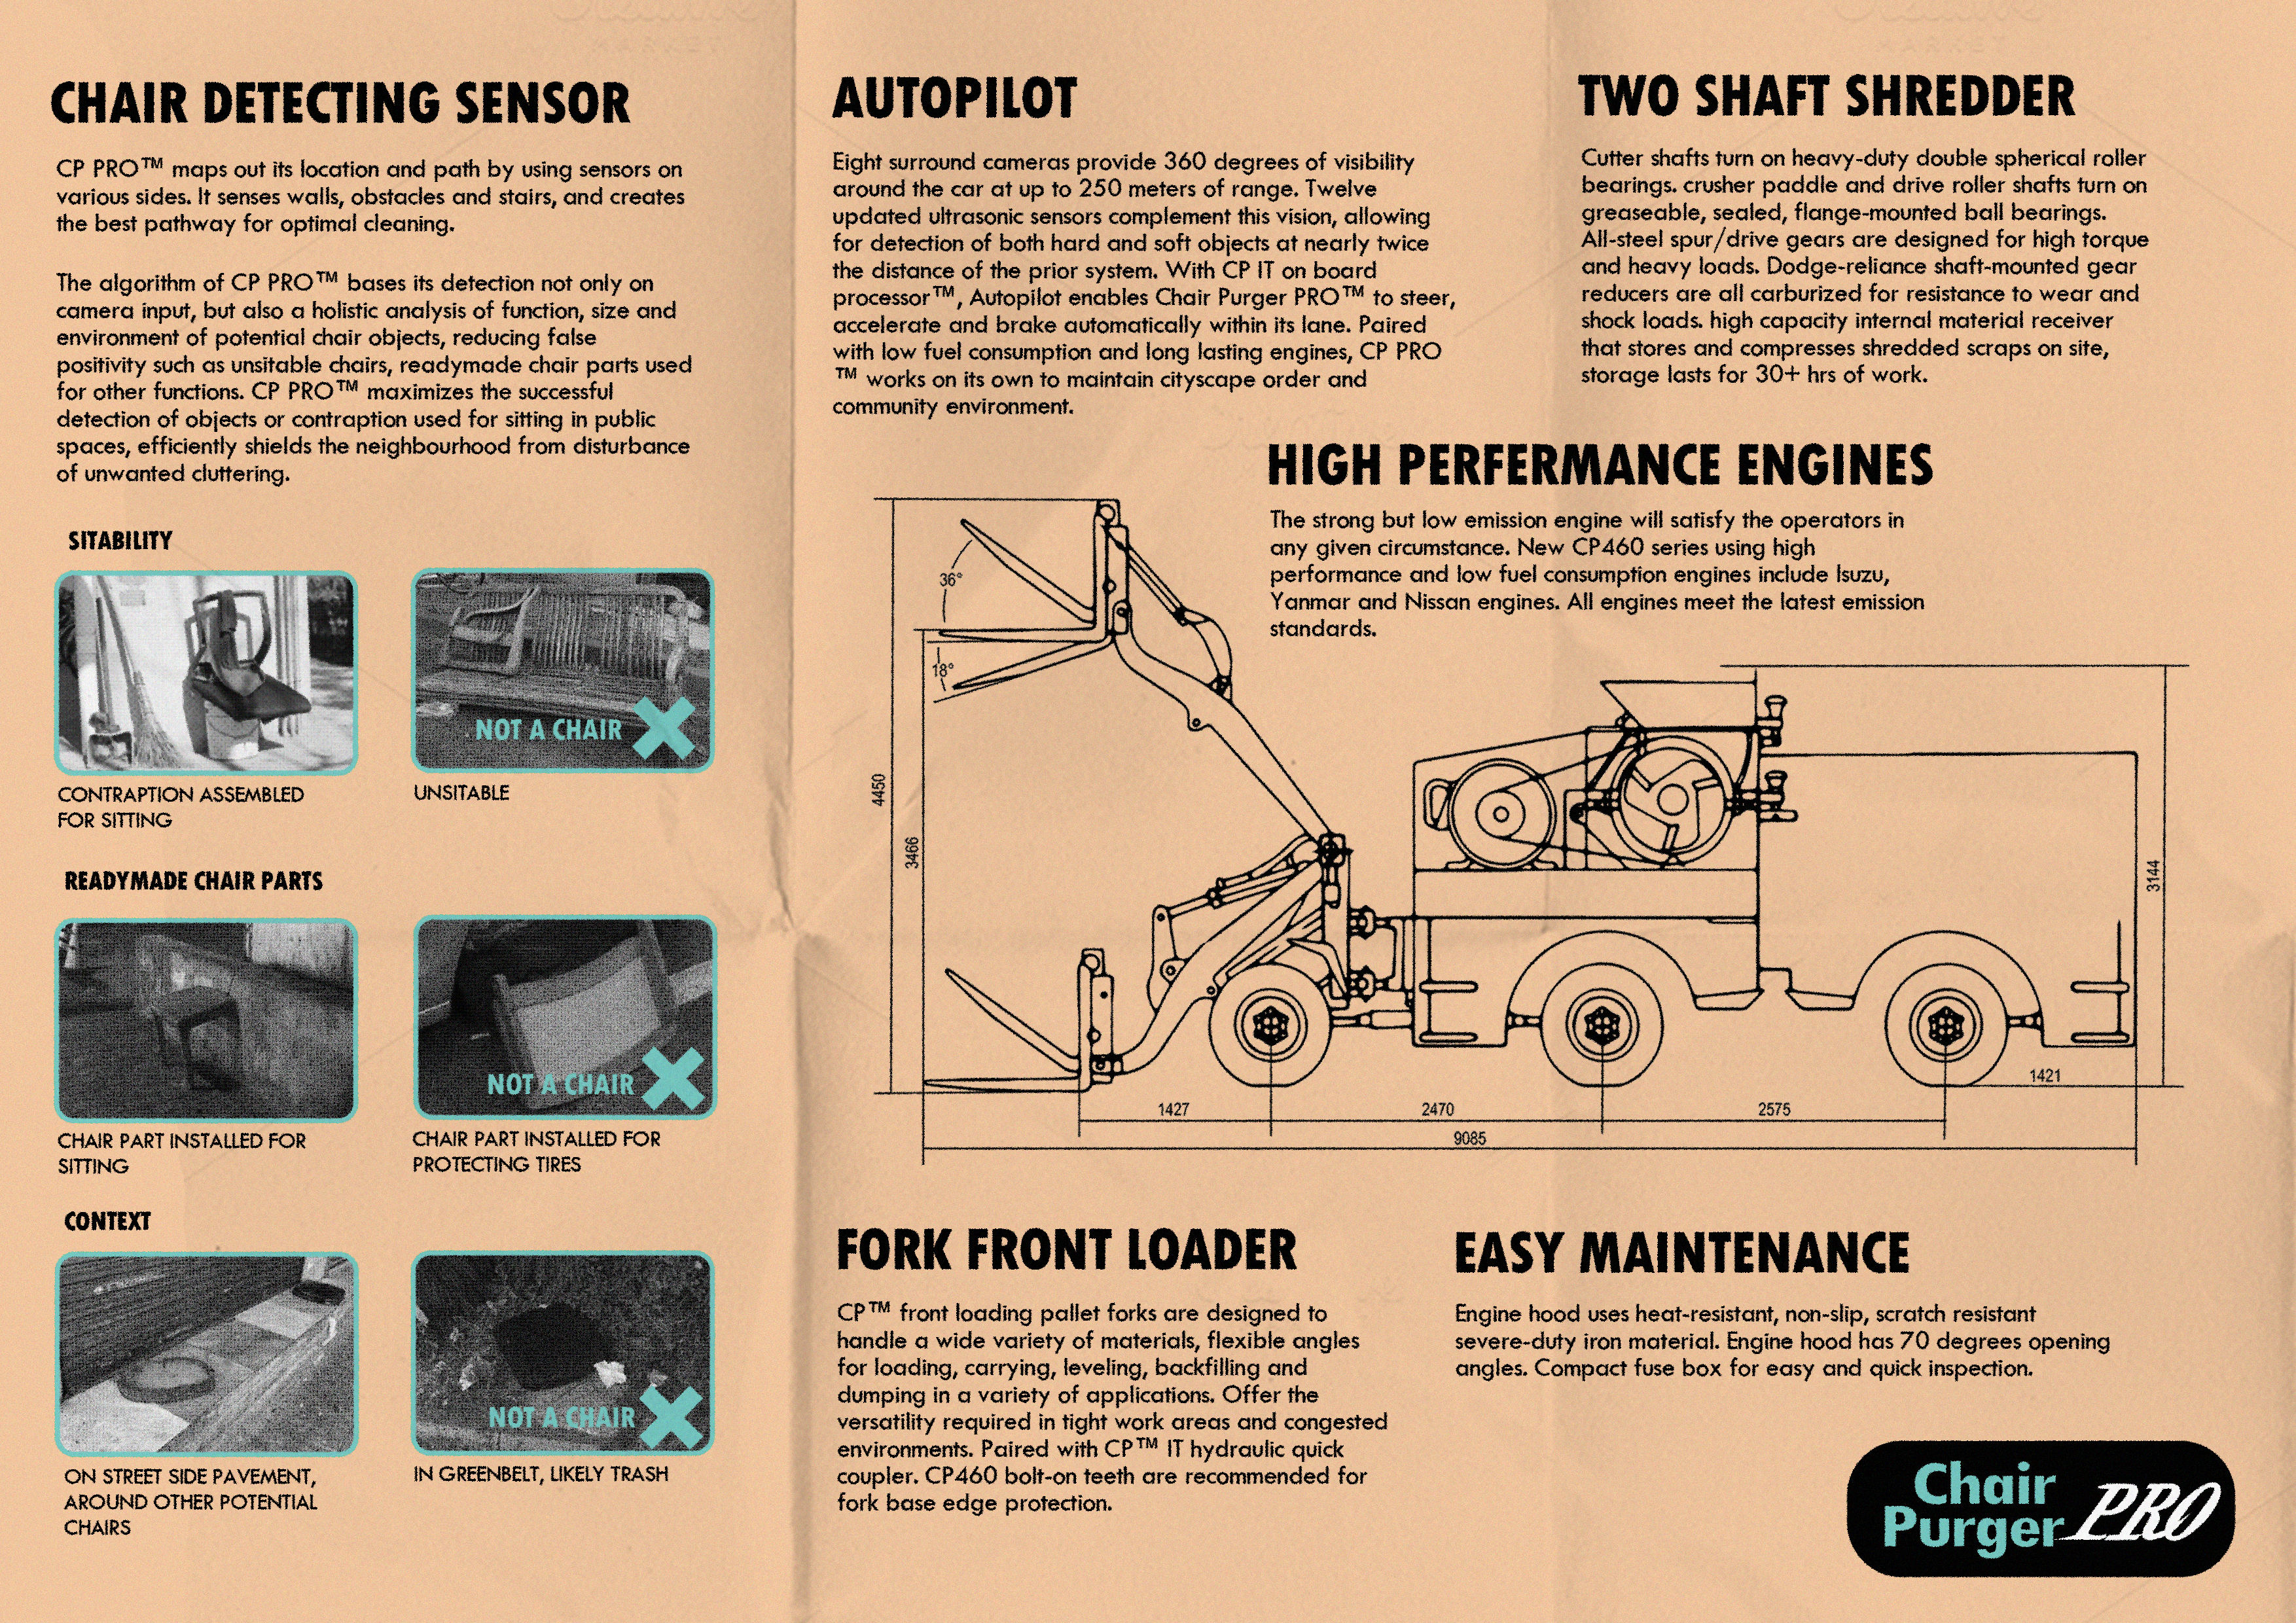
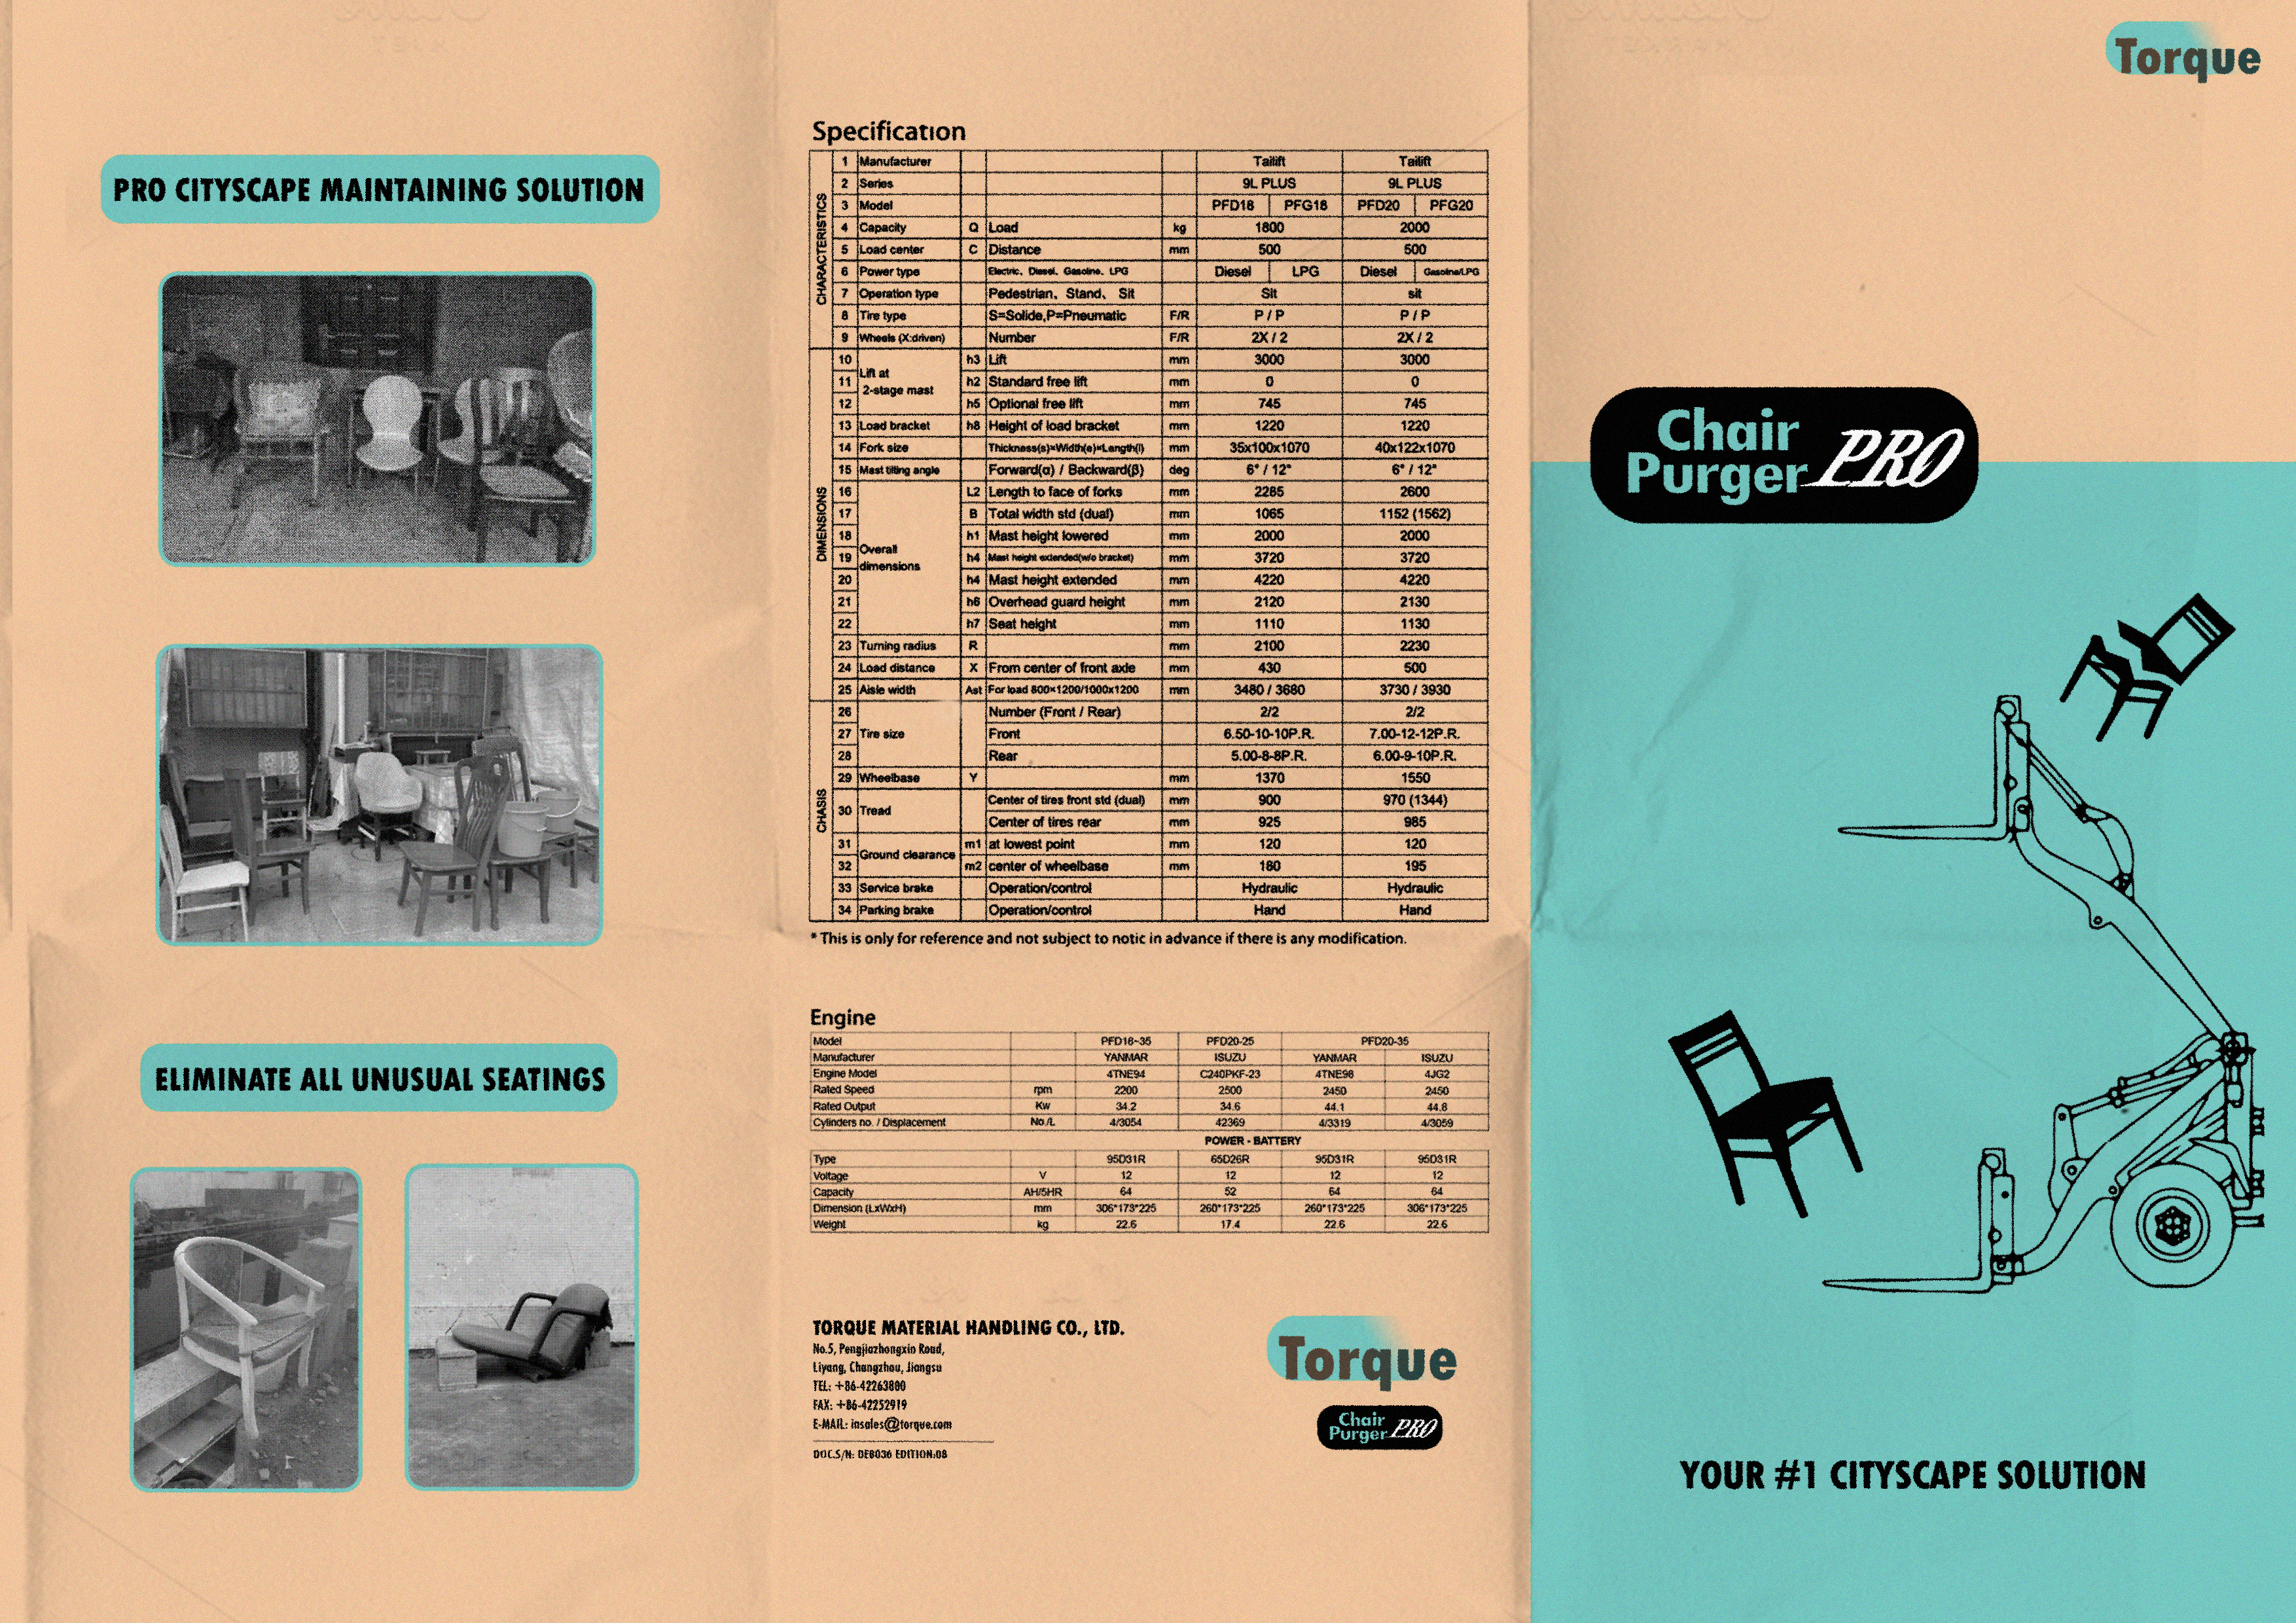
chair purger | flyer for speculative machine
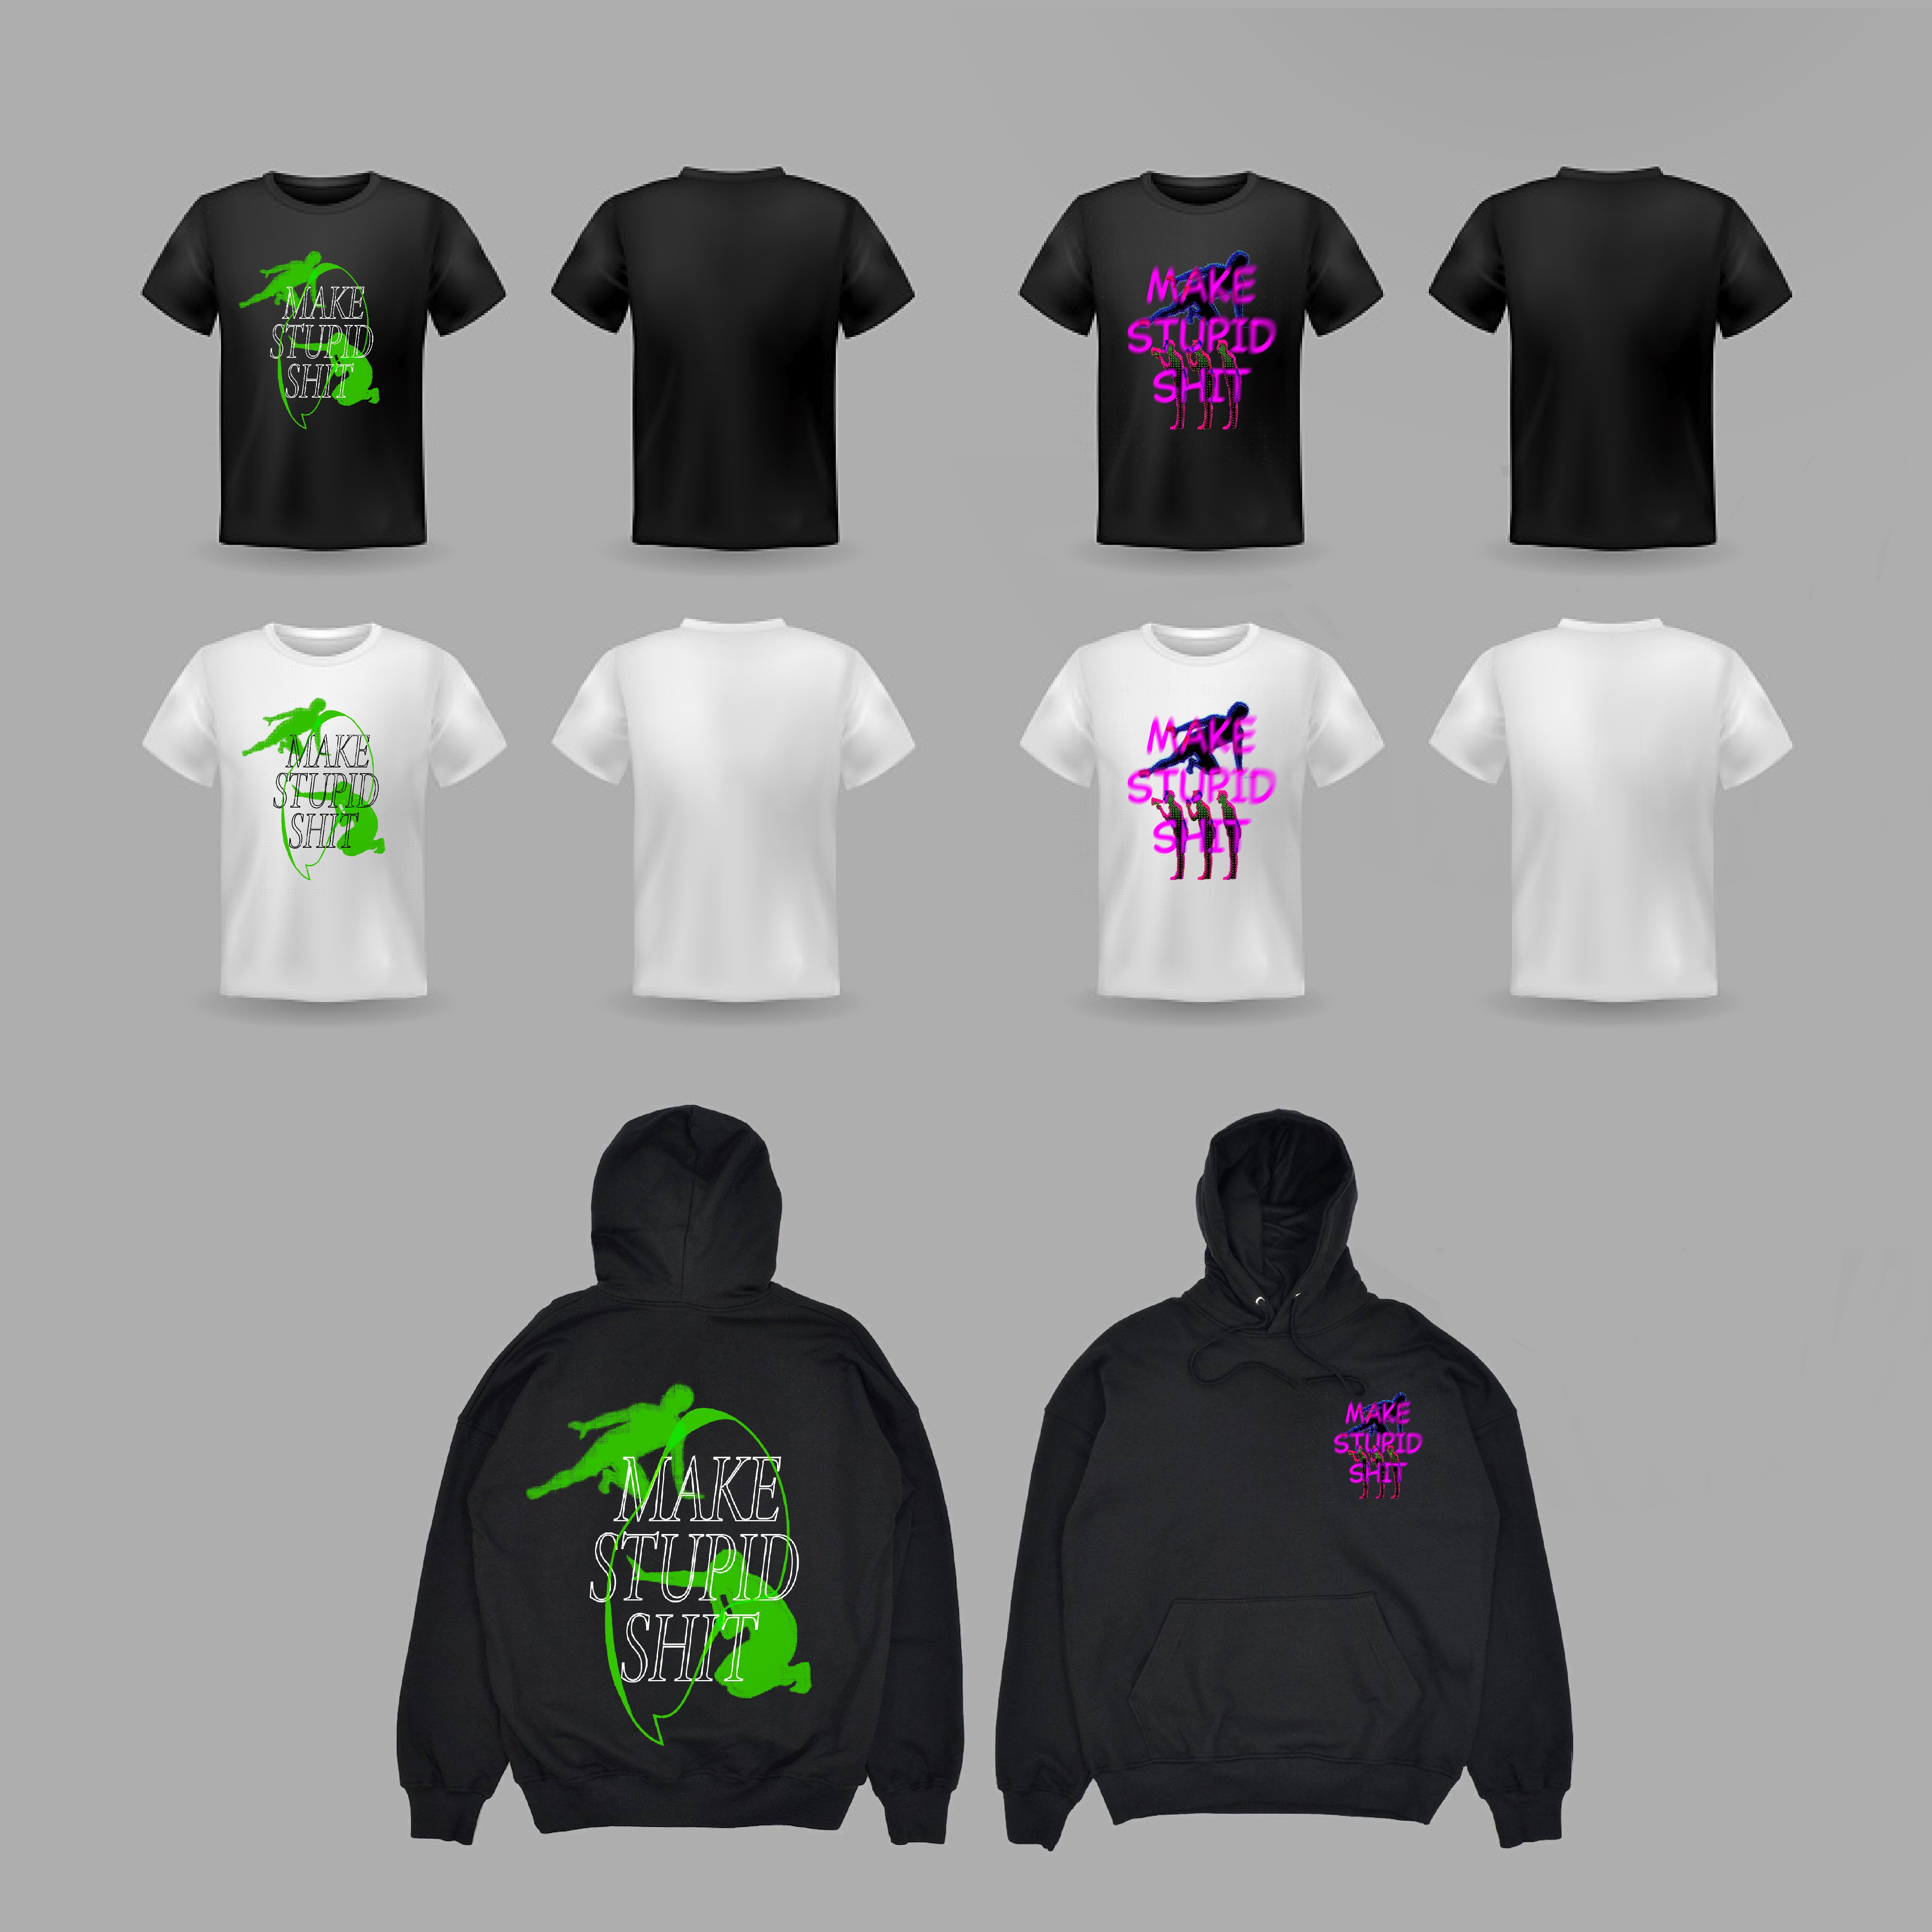
merch and visualizer | Stupid Hackathon 2021 NYU shanghai
flyer (collaborated with yuqing) | Temporary Park 临时公园
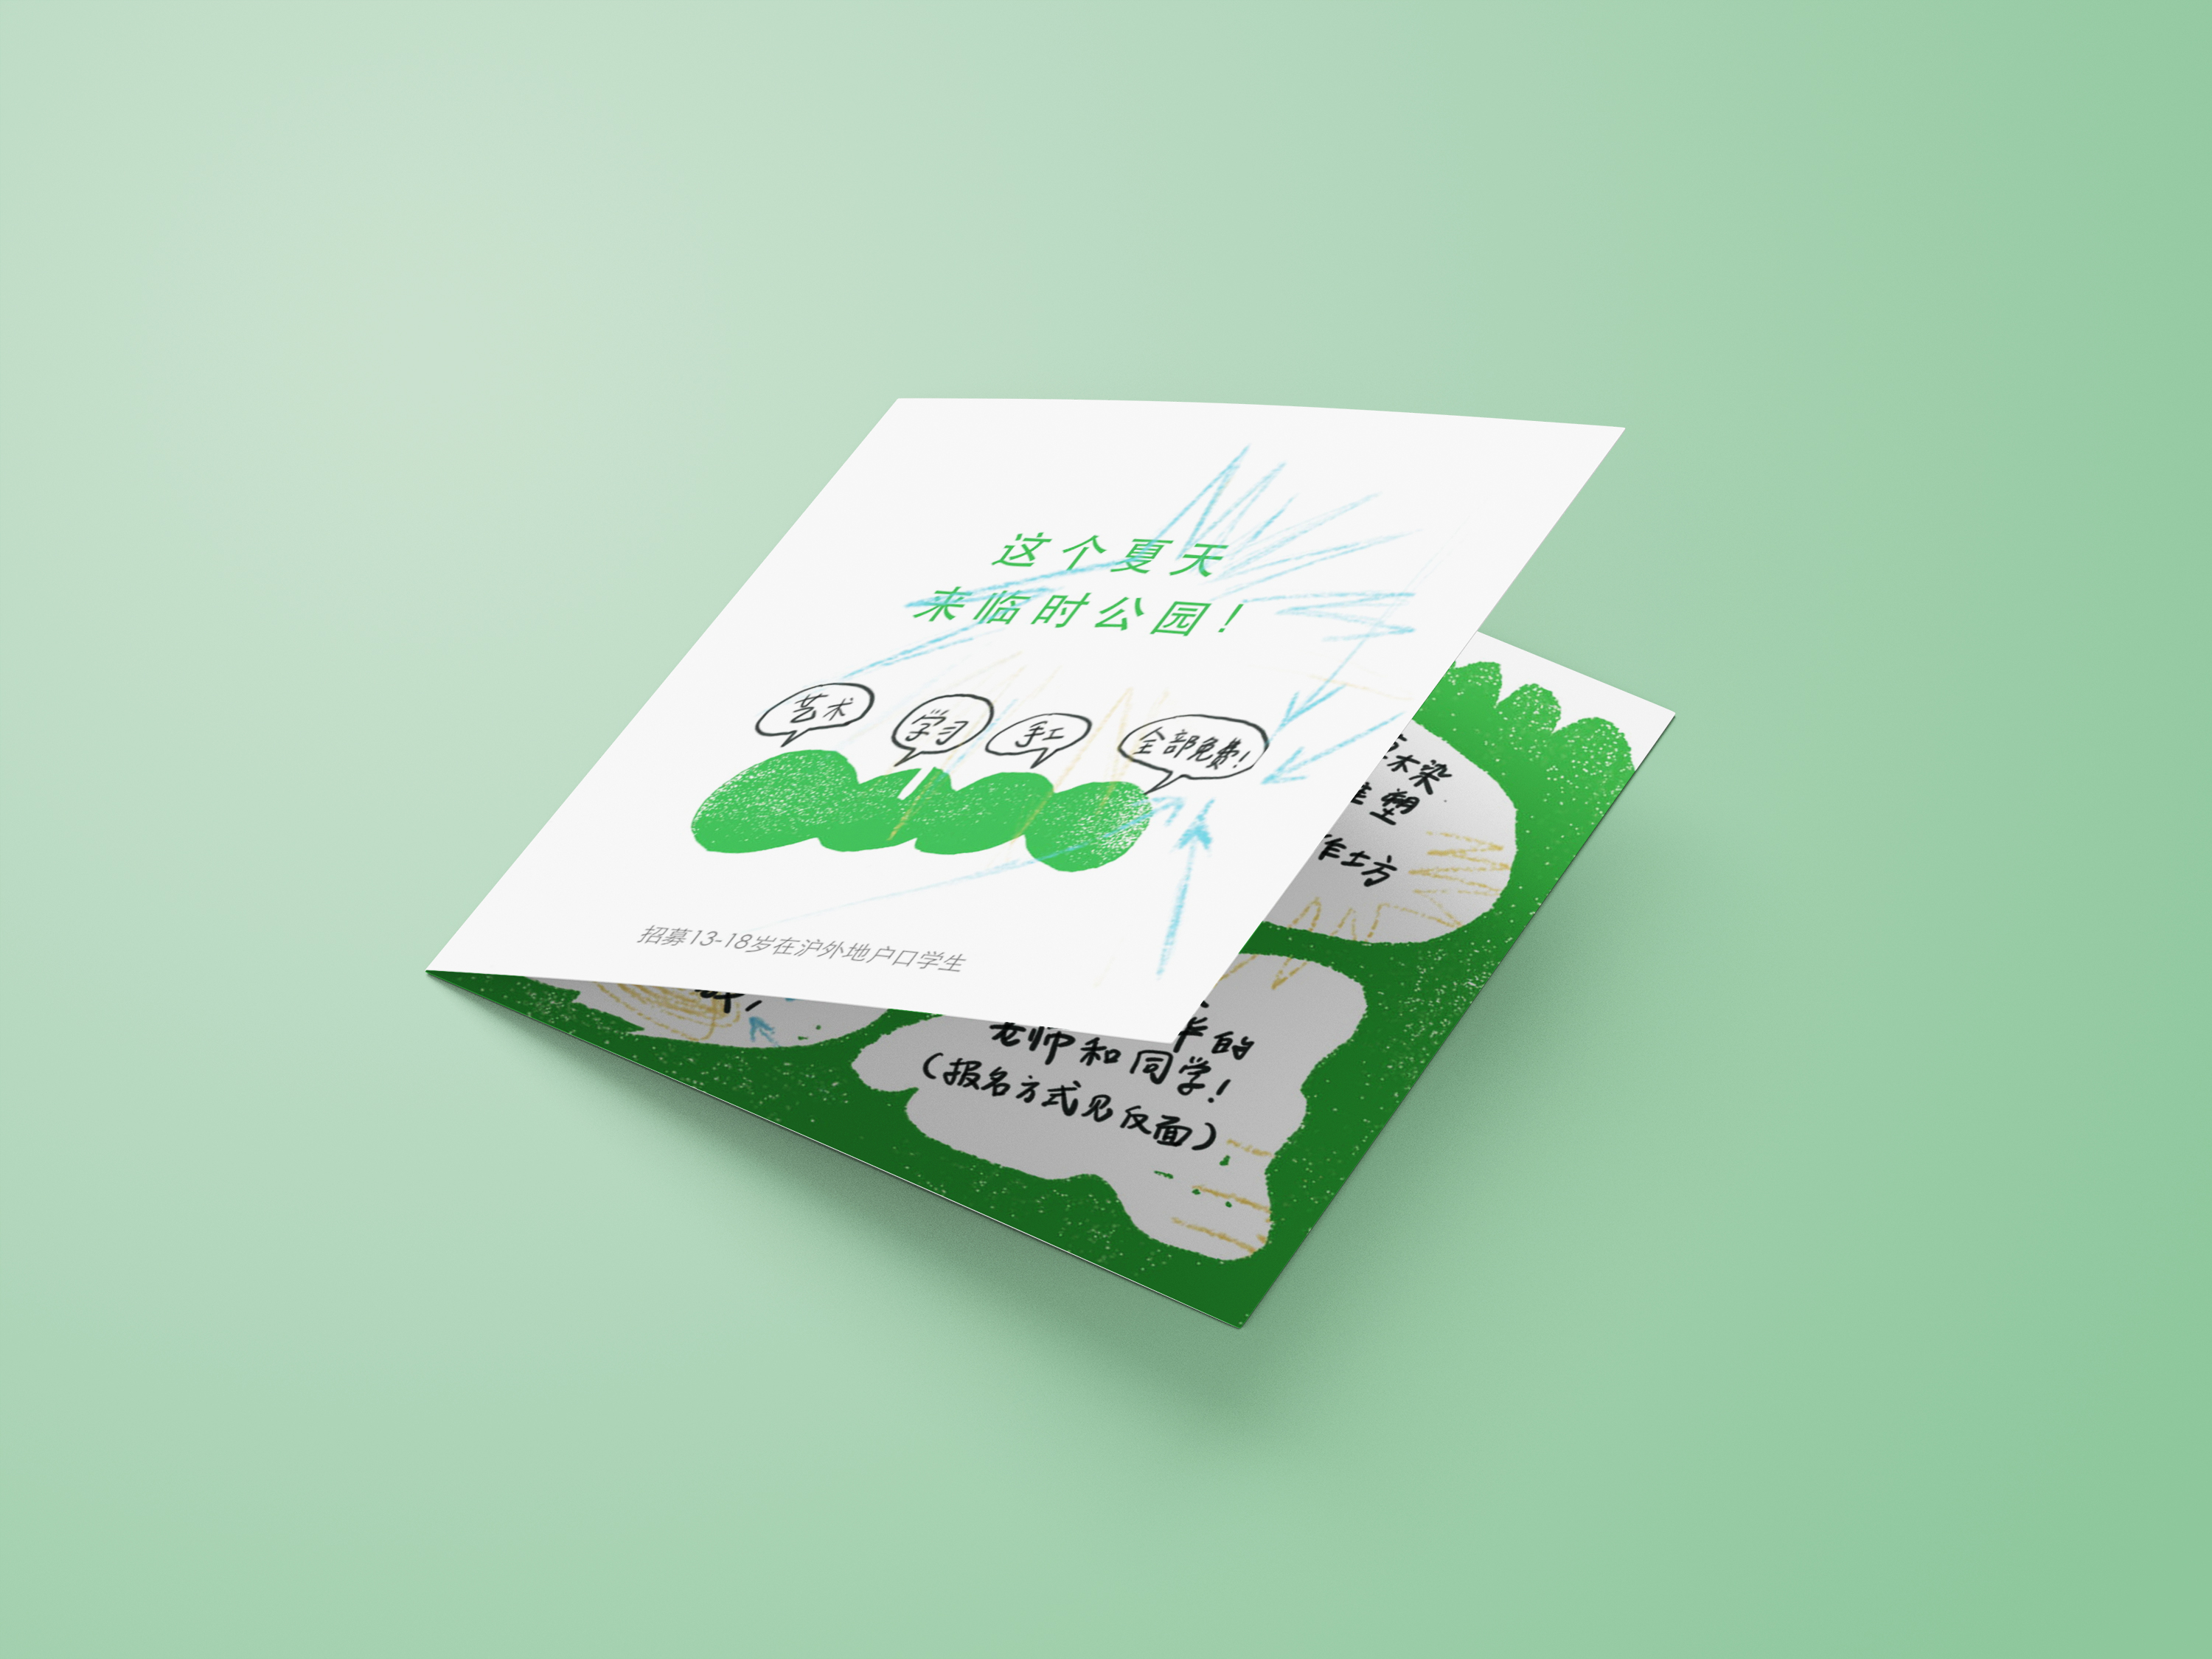
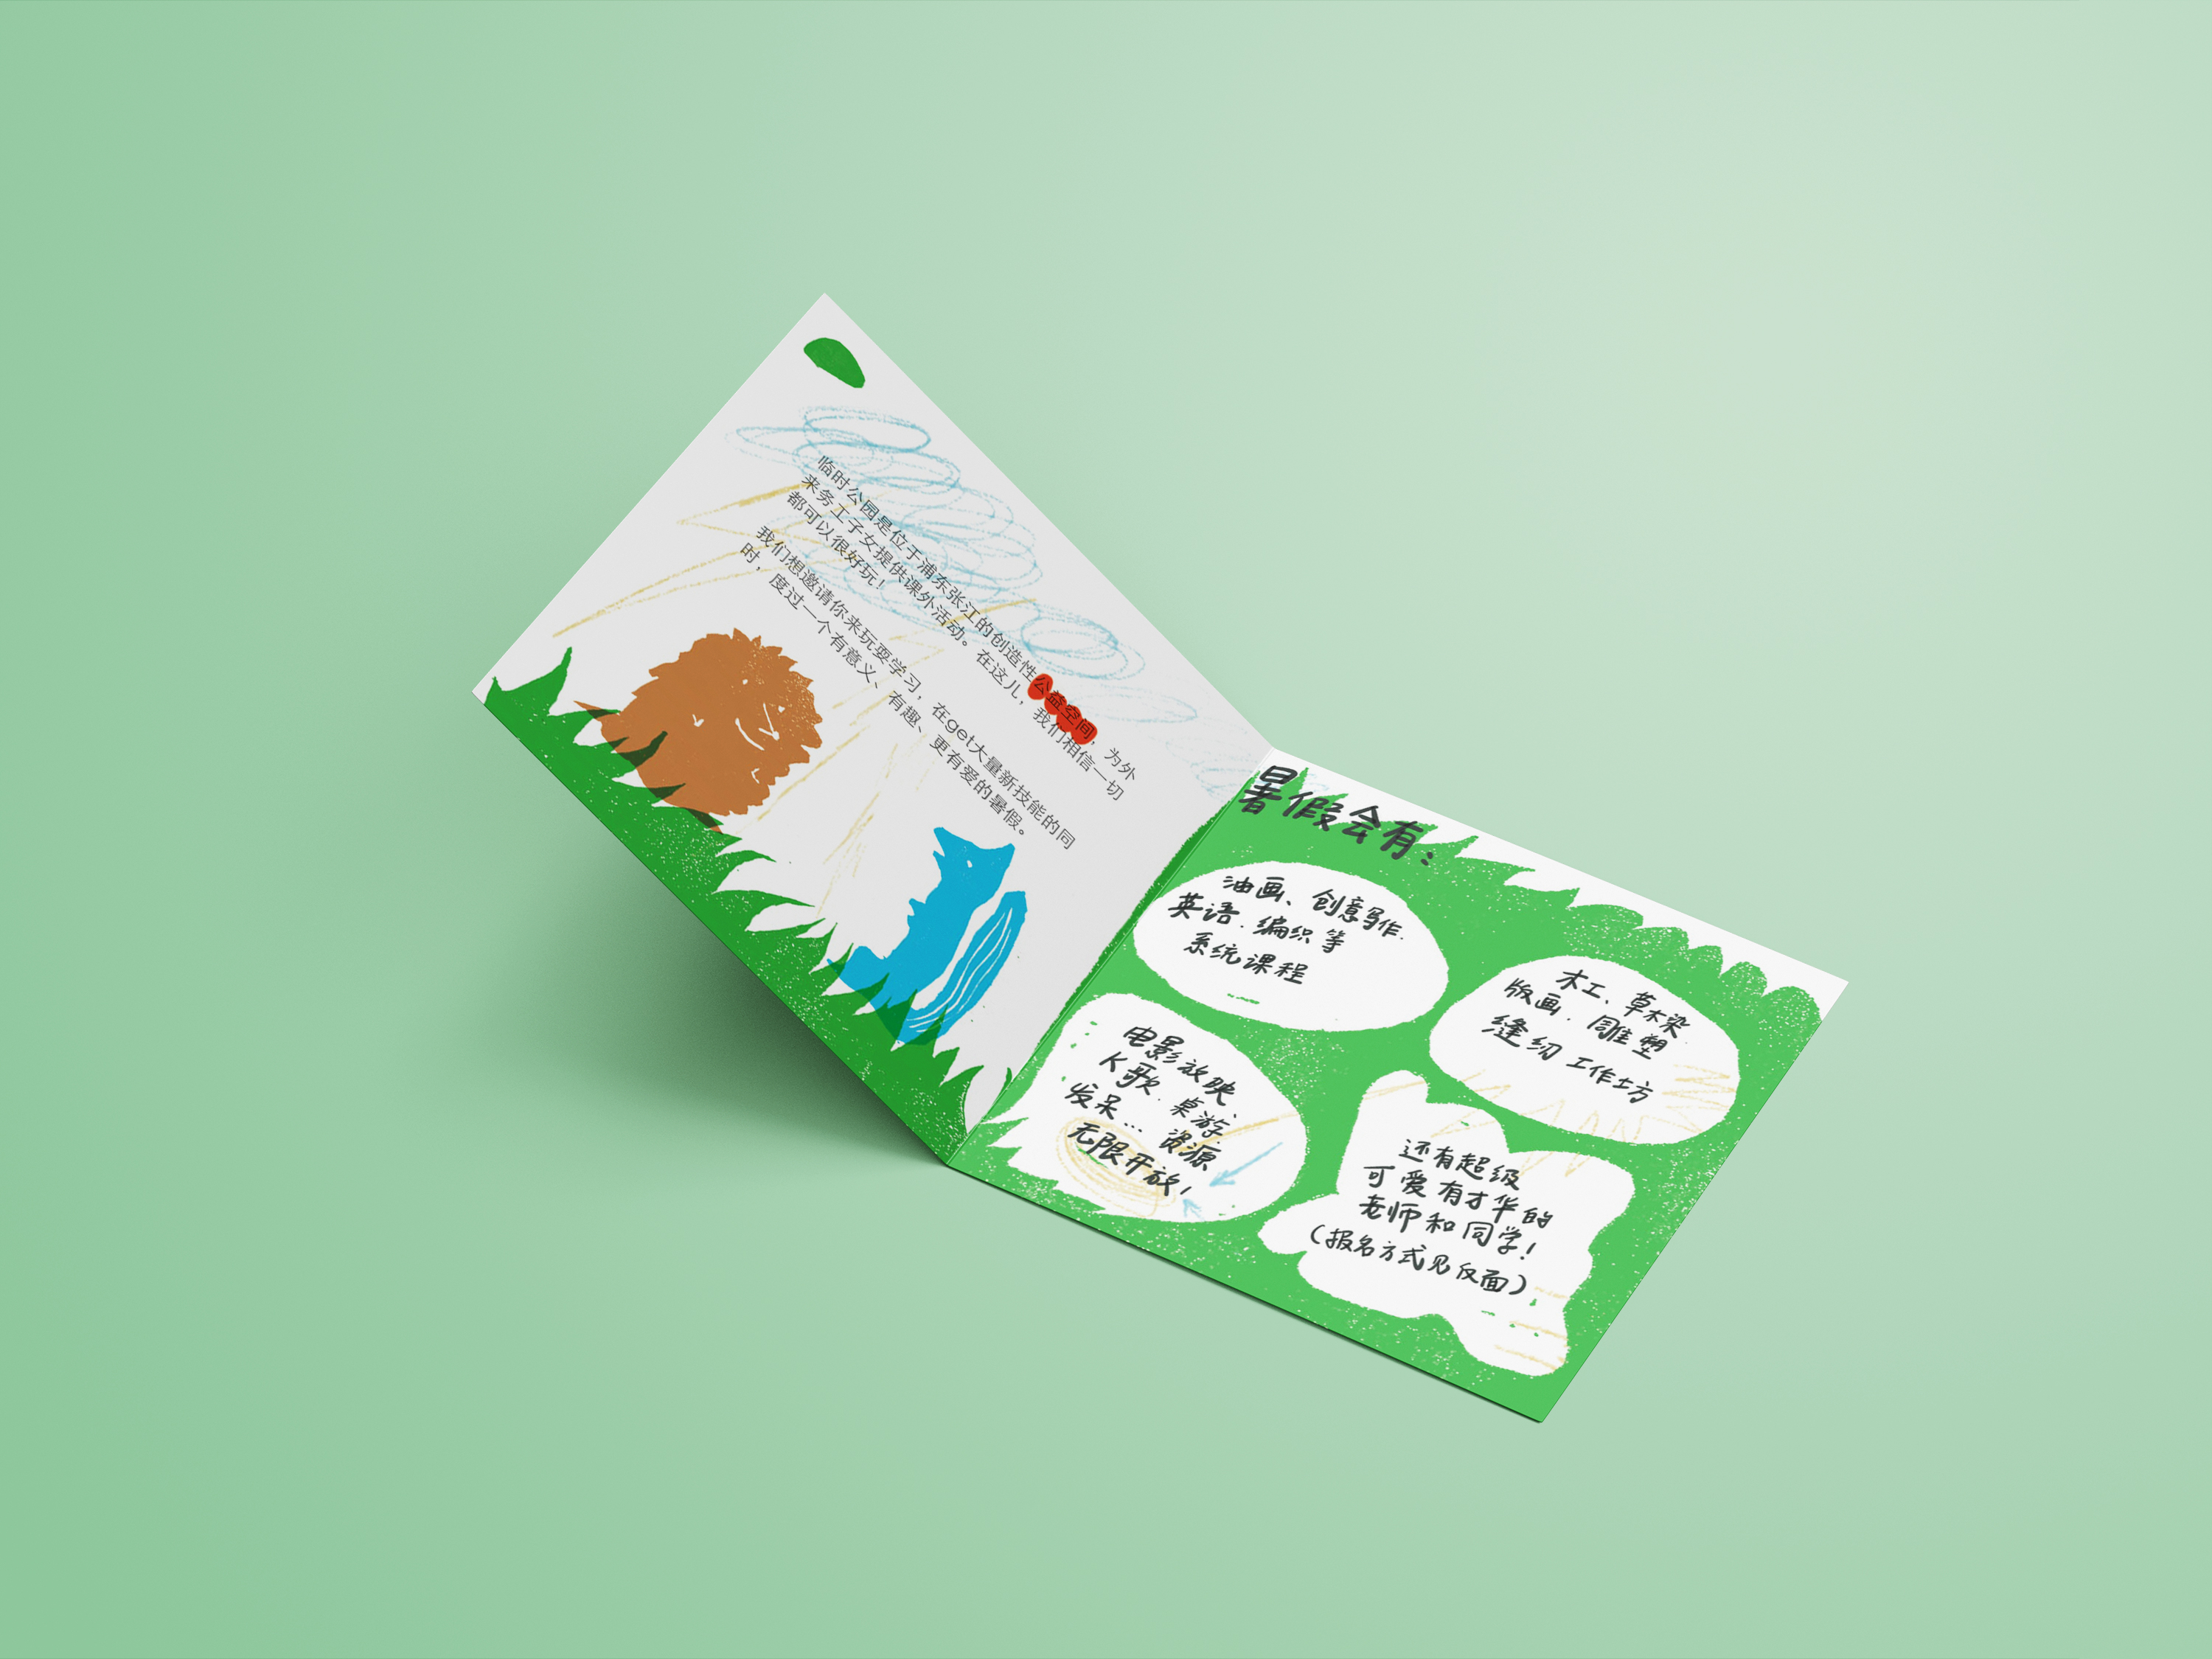
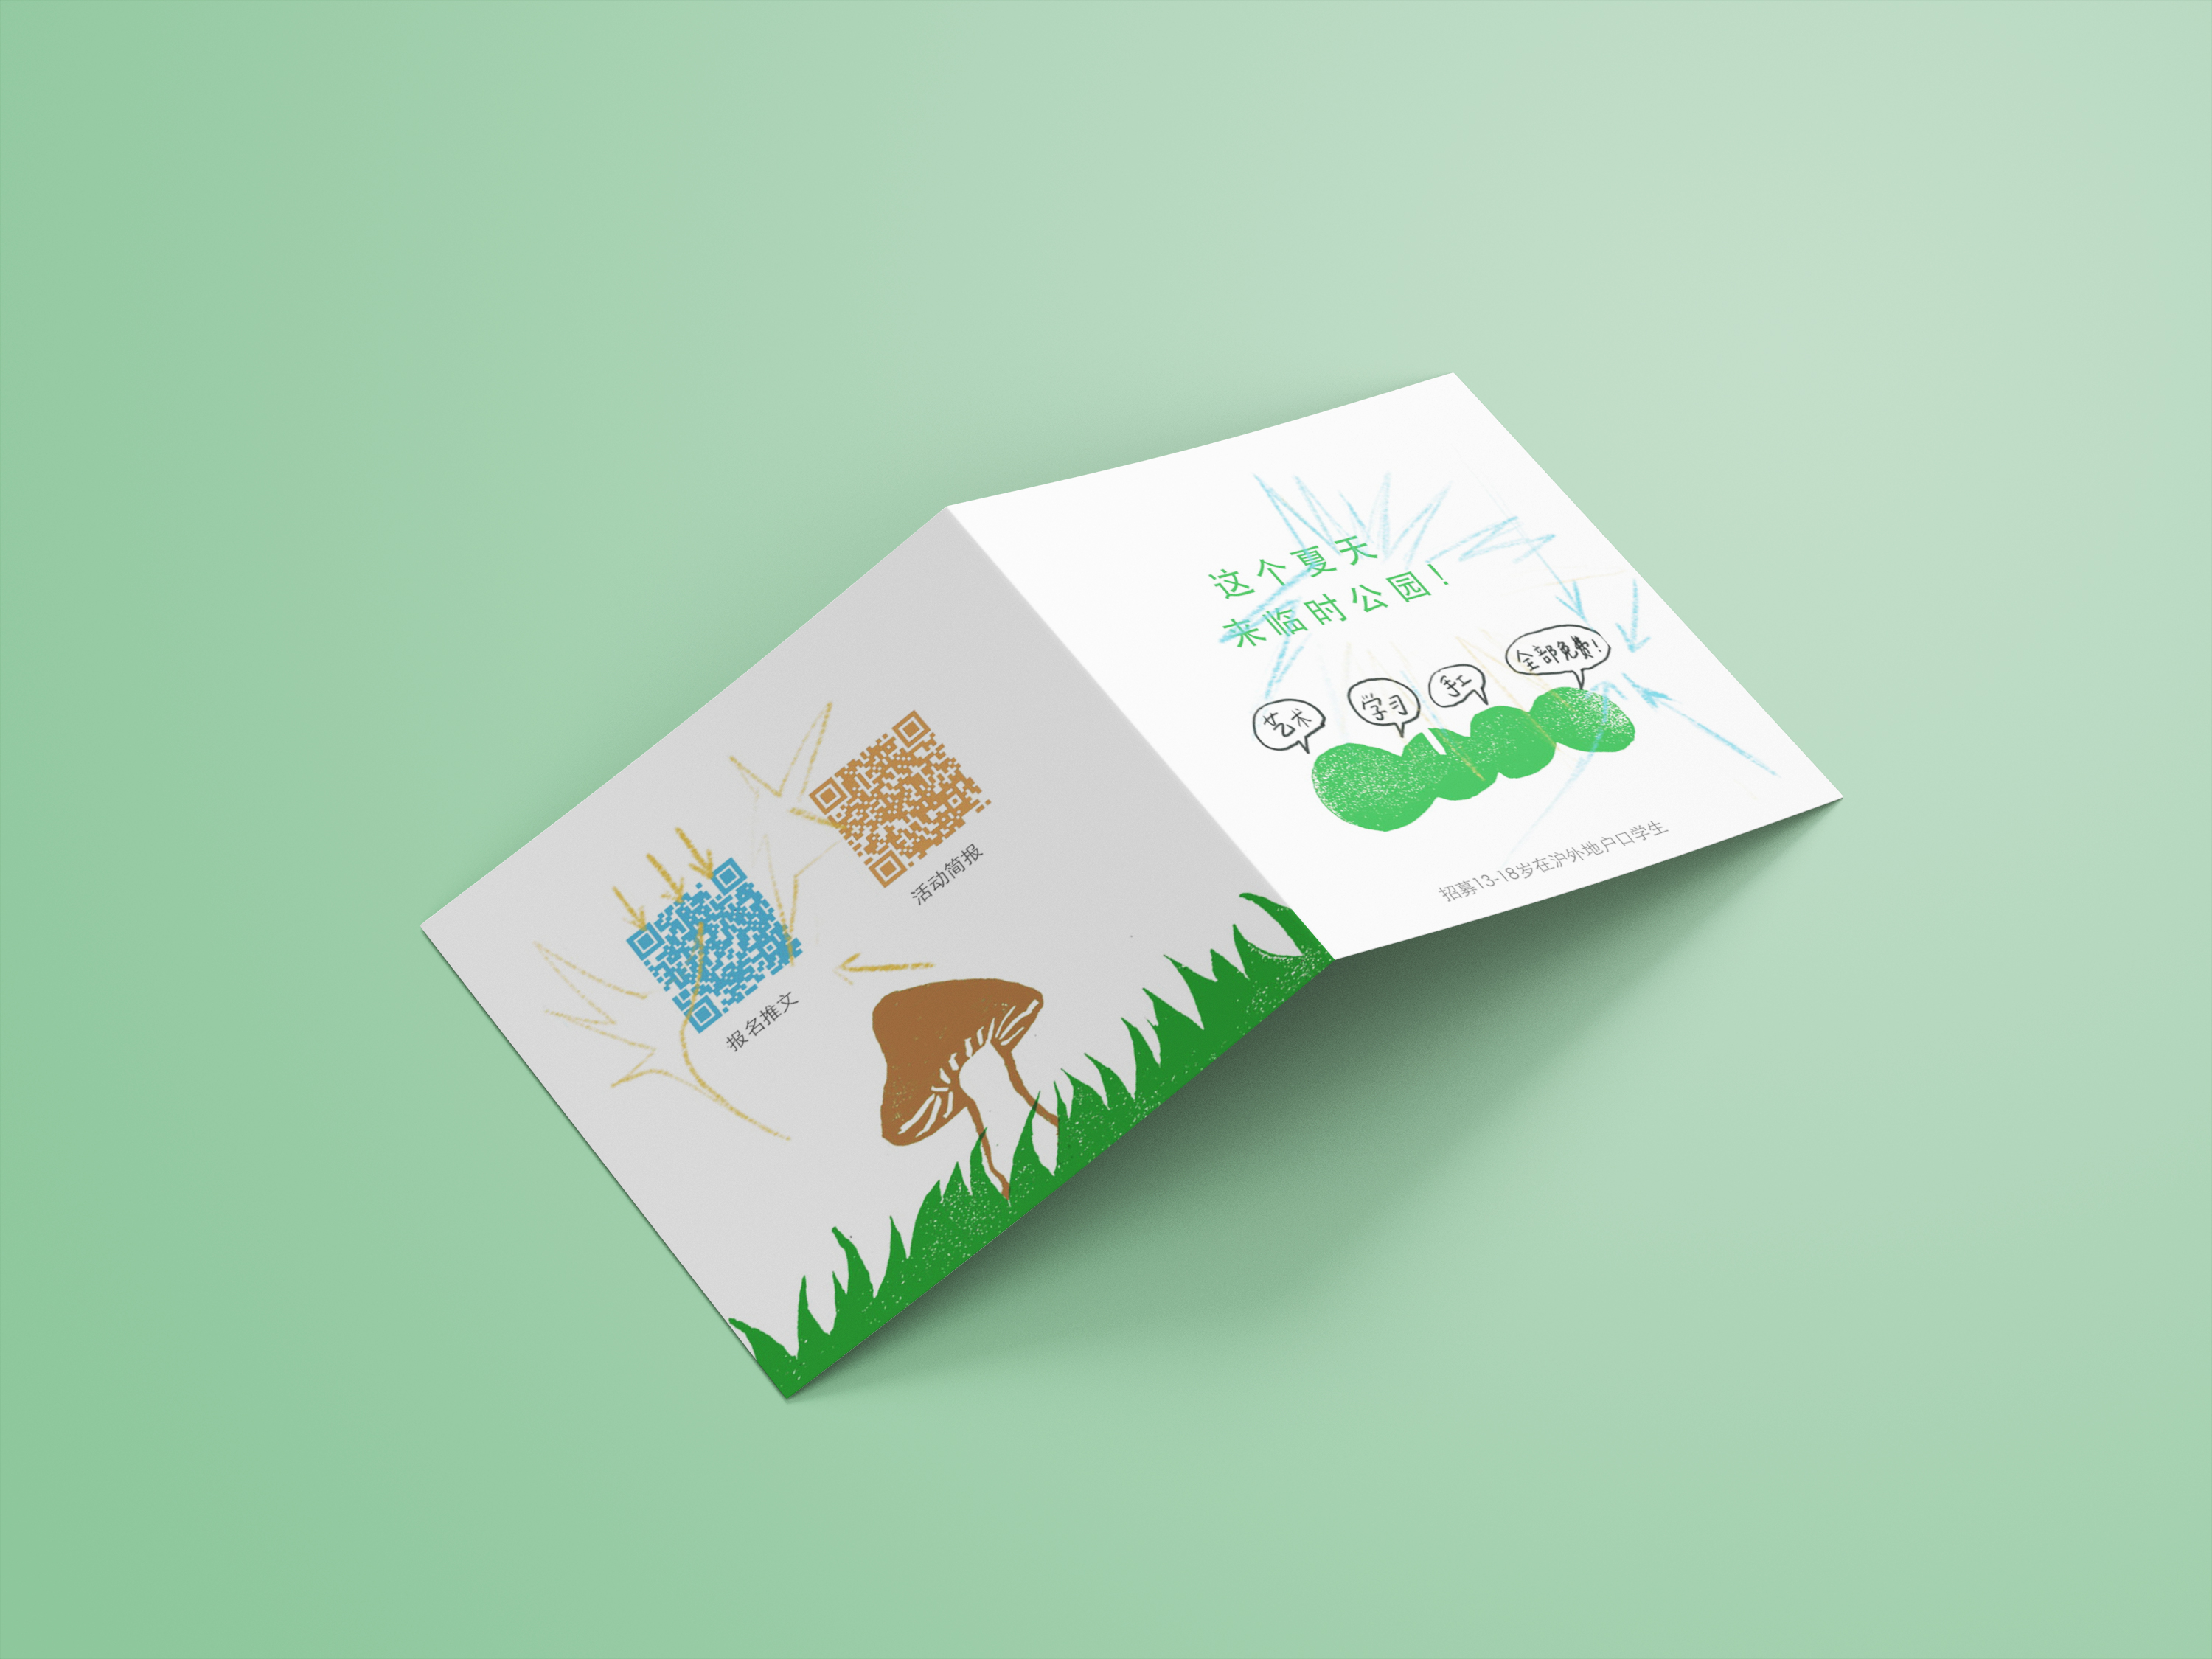
In collaboration with Yuqing Liu, the flyer is designed to recruit student participators for Temporary Park, a mutual aid Non-Profit community project. Graphics are made with hand carved stamps, oil printing and digital manipulation....Temporary park is a non profit creative space and community for children of migrant families in Shanghai and Queer volunteers. By June 2021, Temporary Park has successfully reached its group funding goal, ensuring the payment for satff, guest teachers and the resources for workshops and everyday creativity.
the lyrics of Nick Cave Quantified
If you don't know my favourite band now you know. Nick Cave & the Bad Seeds, what do they do in their lyrics except murder?... methodology for data: scraping: python package LyricsGenius sentiment analysis: python package afinn other: write word processing code on python I chose to visualize the data in a way that shows the progression of lyrics throughout their discograohy timeline.
datazine | act of rebellion
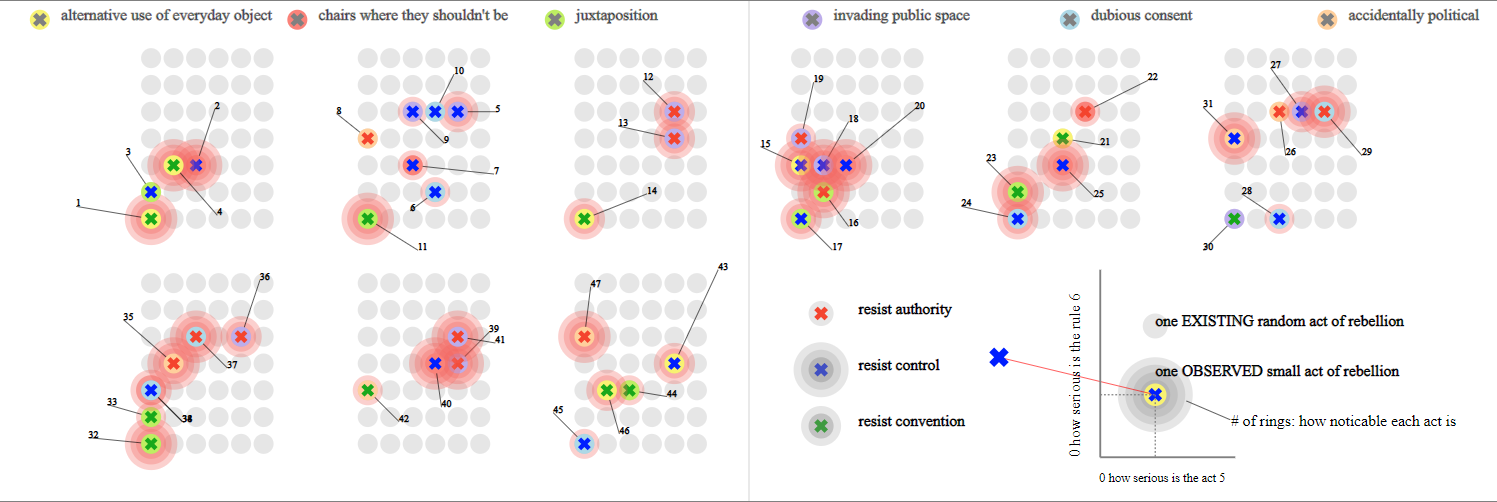
I choose to collect actions that i personally think is against some type of 'rules' (actions that make me think 'technically you shouldn't be doing this' or 'why would anyone do this'). I have realized from taking a walk everywhere that people do stuff that are out of the box quite often. i collected data for 9 days. I kept a mental note of my theme and took pictures or take notes when i saw something that i think would qualify. (This theme has always been on my mind and i did realize it's quite ambitious to represent in the form of data).
...
1. I choose to visualize the data by day and try my best to convey that "small acts of rebellion" are always present whether we are aware of them or not, by showing grey dots in the background. They can be literally against the law or not at all, and they can be quite obvious or rather discreet, shown by the size of the rings around each datapoint. (Even when the acts are obvious, we wouldn't necessarily realize they are in any way 'rebellious'. But that is also point: when i showed my original data to a friend, they didn't think they would call some of them 'rebellious'. I hope to convey that the ordinary acts can feel natural, unremarkable but they also have a purpose that is somewhat rebellious at heart. )
2. I position the datapoints according to y-axis(how serious is the 'rule' that the act is against), and x-axis(how serious/consequential is the act itself). I thought it might be interesting to see the constrast between how noticable the act is and how in actuality serious is the consequence.
3. I roughly categorized the datapoints by type (why do i think they qualify as 'rebellious', according to definition on the front page.), and theme. Just to give them more attributes to look at.
From the data and my categorization, it seems that i observed 20 out of 47 points are "resisting control", which when i made this categorization i mean it's something a security guard would come and stop you from doing.
I made compromises in the sense that the events I collected lost their rich details in order to fit in the form of data points. I also put zero effort in optimizing the visual aesthetics of this project because of time and energy.
If the project is of larger scale, I would imagine a website with many, many dots, each representing a 'rebellious act of everyday life' and readers can contribute to the content, and click/hover to see more details of possibly text/picture/video/audio forms. It would be fun to look at such a website and realize how we are consciously or unconsciously breaking the 'rules'.
manifesto: collage and webcollage
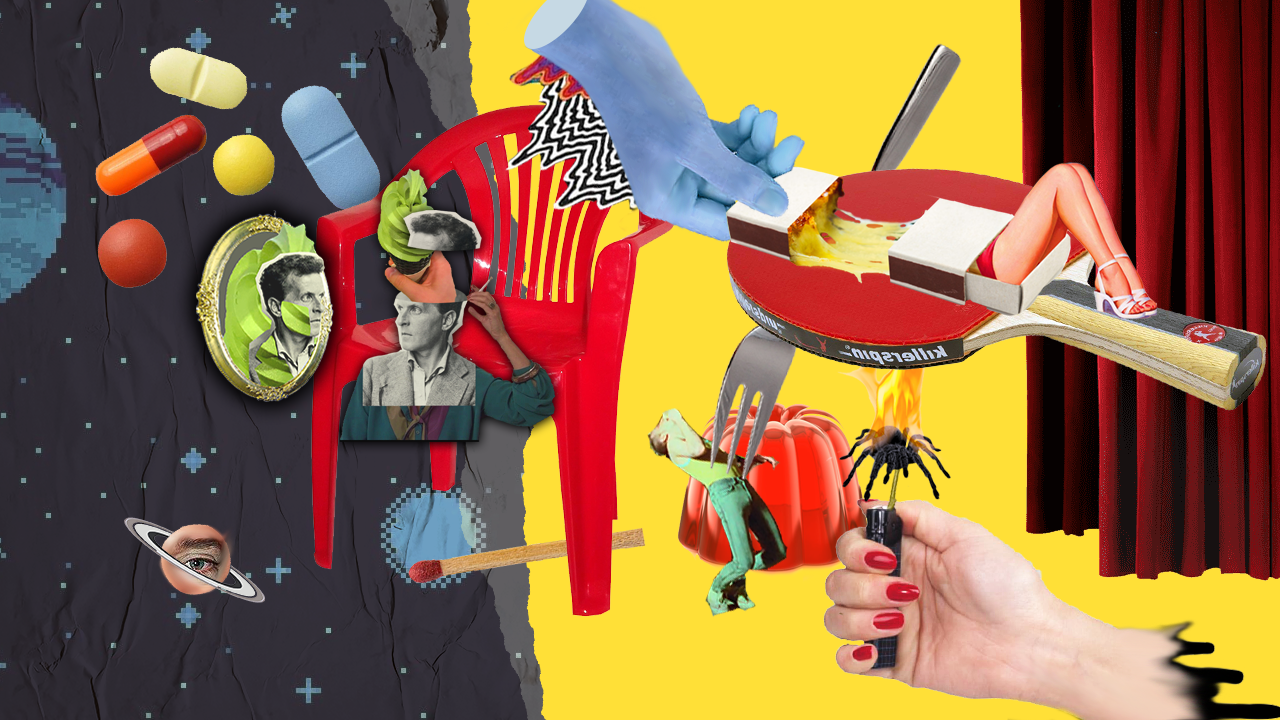
A combination of words and graphics representing the principles of creating from me in February 2020.